Wallet Summary
Start here. The wallet summary gives you the top-level view: total PnL, win rate, number of tokens traded, and ROI distribution.Currency Denomination
Wallet summary, history, and performance support?currency=usd|sol|eur (default usd). When you pass sol or eur, monetary values are converted at read time and the response includes a top-level "currency" field.
Historical SOL/EUR values are approximate — each day uses that day’s reference rate, so cumulative converted values won’t chain perfectly across days. Field names stay USD-oriented in some places (e.g.
activity.volume.costUsd); use the top-level currency field to determine denomination.Token Positions
The positions endpoint lists every token a wallet has traded. Sort by PnL, ROI, or value. Filter by holding state, market, minimum invested amount, and more.PnL Mode
The wallet summary, positions, and single-position endpoints support?pnlMode=strict|adjusted|raw. Default is strict, which filters out positions with sell amounts greater than buy amounts (usually invalid). Switch to adjusted for a cost-basis-corrected view, or raw to see everything unfiltered. See the Essentials for details.
Common Filters
Show only profitable positions
Show only profitable positions
Show currently held tokens
Show currently held tokens
Filter by minimum investment
Filter by minimum investment
Filter by specific market (e.g. pump.fun)
Filter by specific market (e.g. pump.fun)
Single Position
To drill into one token, use the wallet token position endpoint:PnL Calendar
The PnL calendar endpoint shows how a wallet’s PnL changed day by day.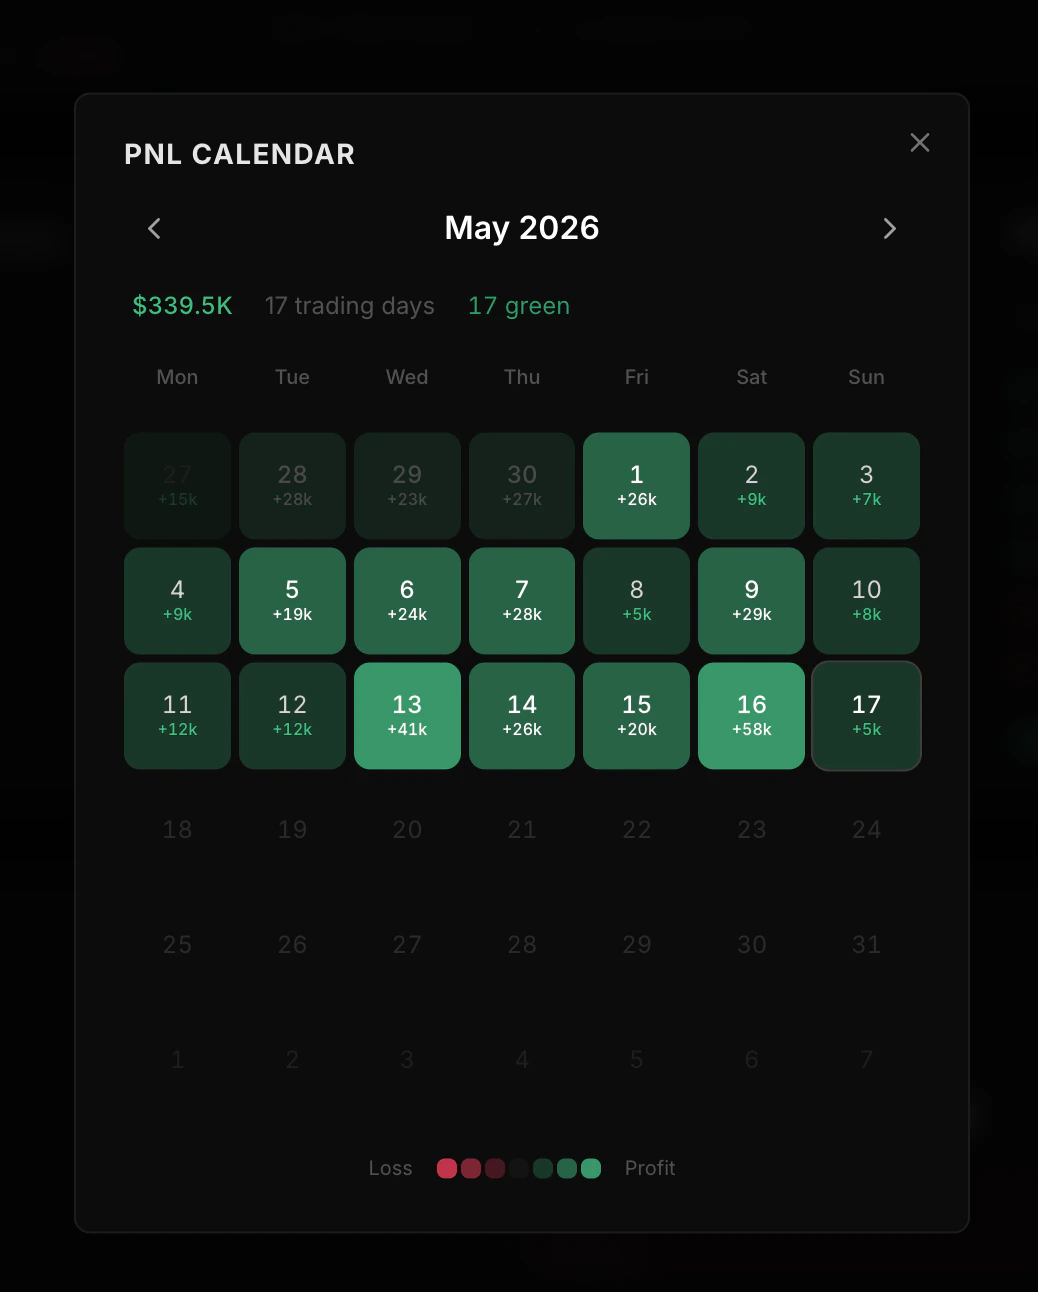
- Running totals — PnL, invested, and proceeds as of that day
- Daily activity — that day’s realized PnL, volume, and trade counts
Choosing a time window
The history, performance, and KOL period endpoints all accept rolling windows. They share the same three knobs:
All three options produce rolling windows anchored to “now” unless you pin them with
start/end. period=30d and days=30 return the same trailing-30-day window — pick whichever is more convenient. Send start/end only when you need an exact calendar range.
Chart Data
The chart endpoint returns up to 180 daily data points for plotting equity, realized PnL, and activity.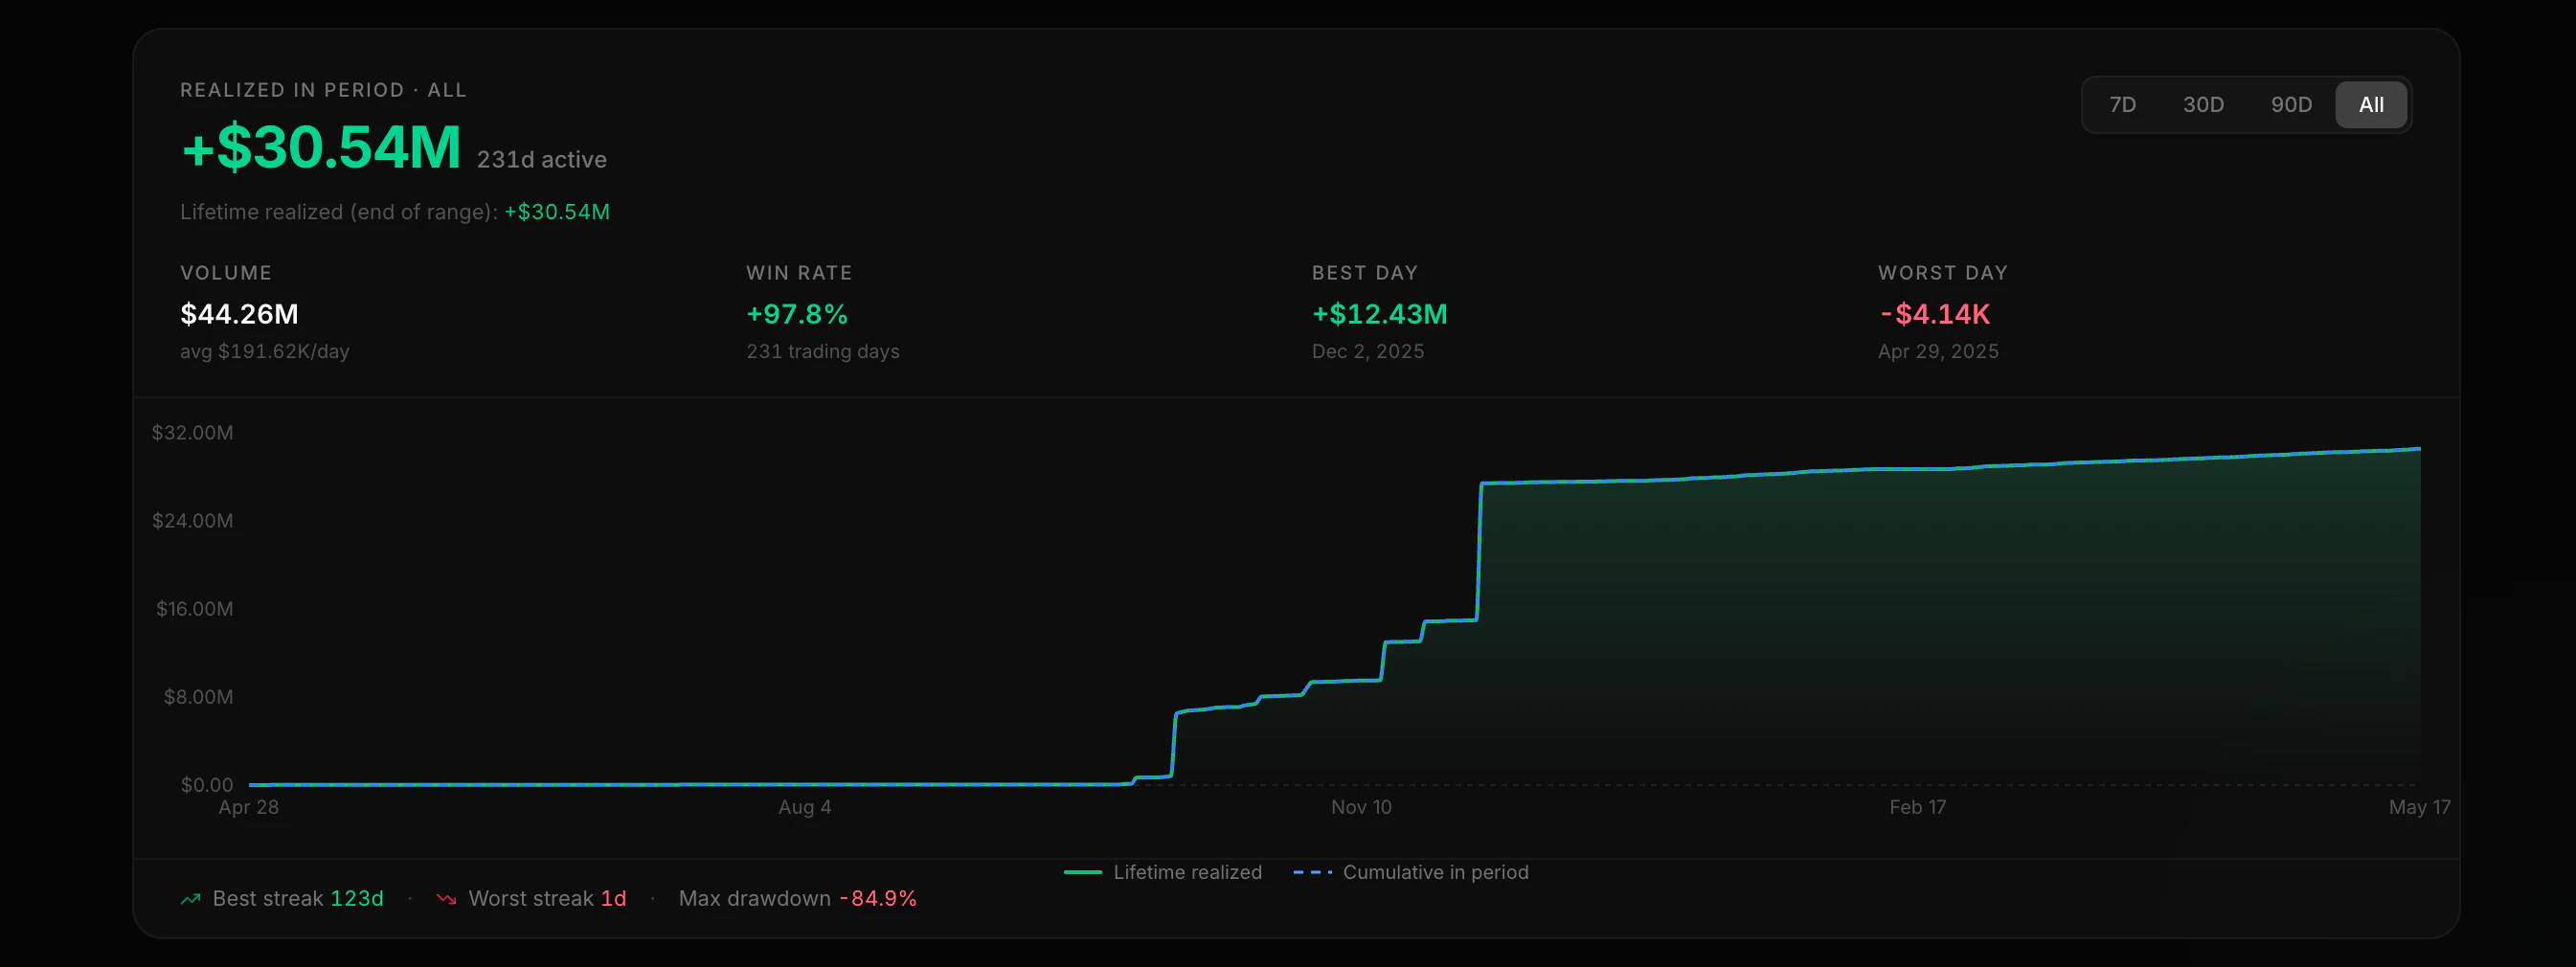
time_from and time_to (Unix seconds) to page through older data.
Performance
The performance endpoint gives you rolling stats: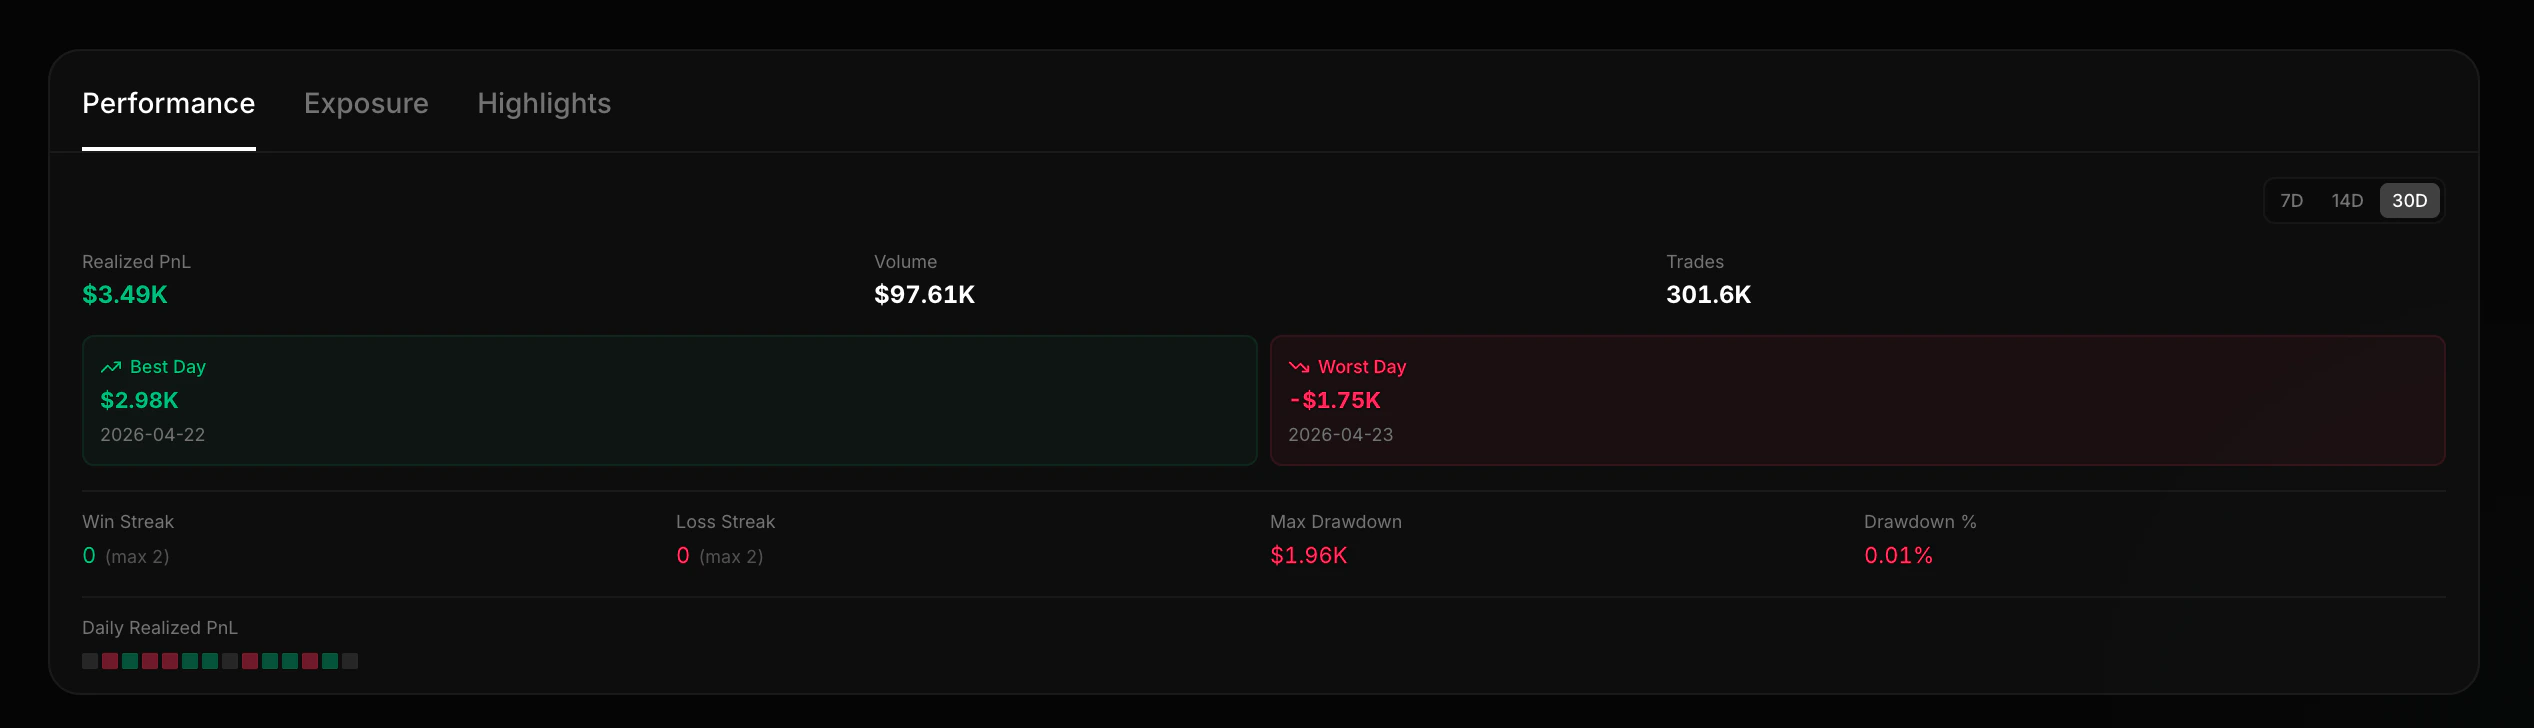
Highlights
The highlights endpoint returns a wallet’s most notable positions: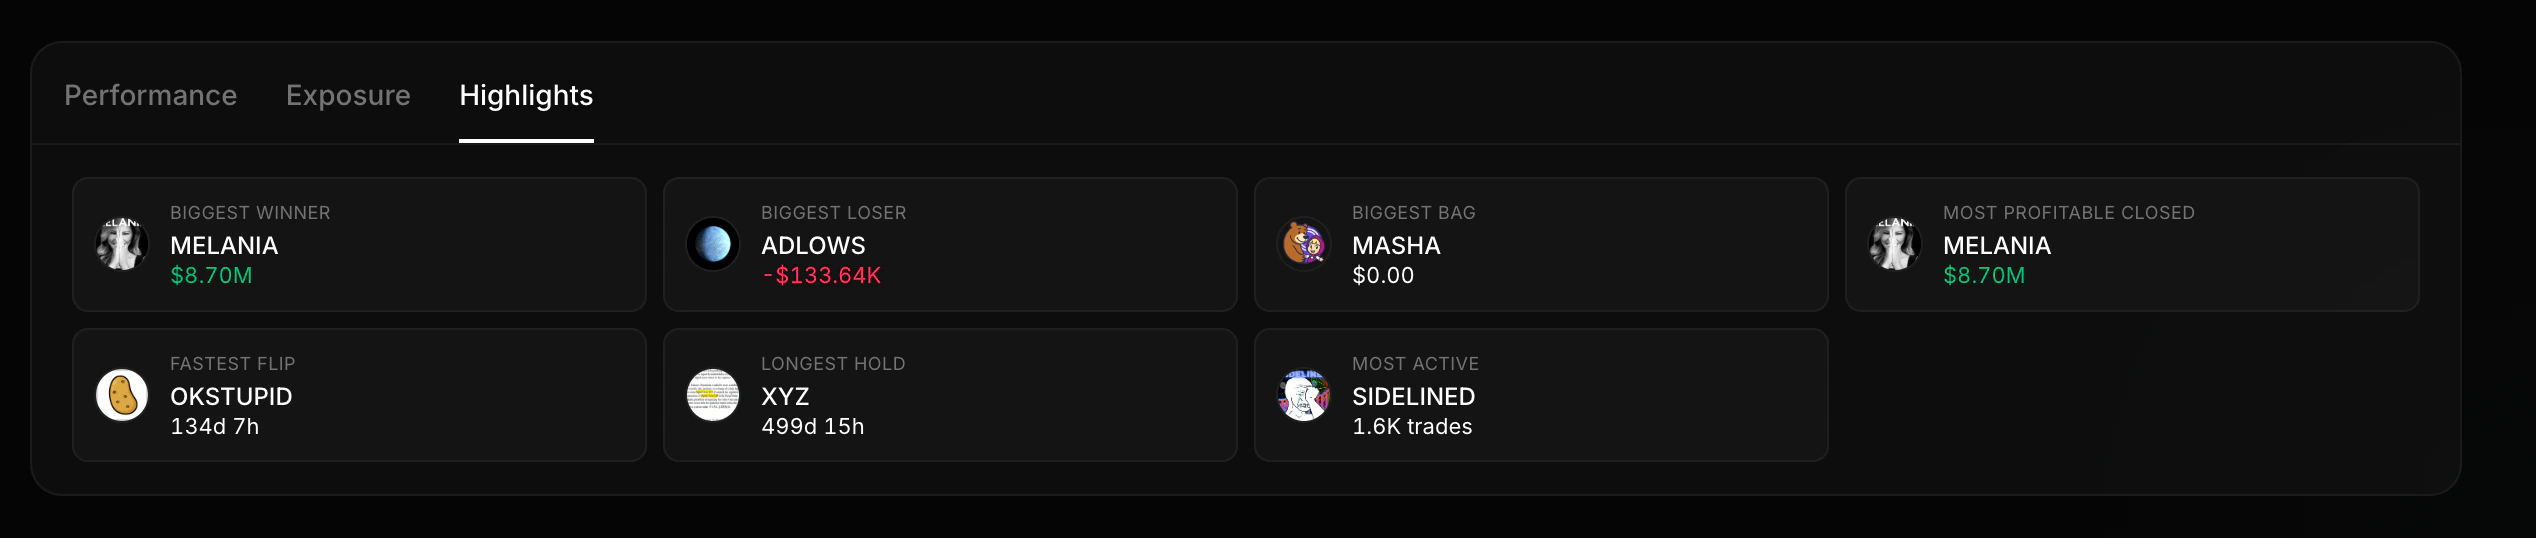
Biggest Winner
The position with the highest realized PnL
Biggest Loser
The position with the worst realized loss
Fastest Flip
Shortest hold time with a profit
Longest Hold
The position held for the most time
Largest Bag
Current holding with the highest USD value
Most Traded
The token with the most buy/sell transactions
Risk
The risk endpoint evaluates current portfolio exposure: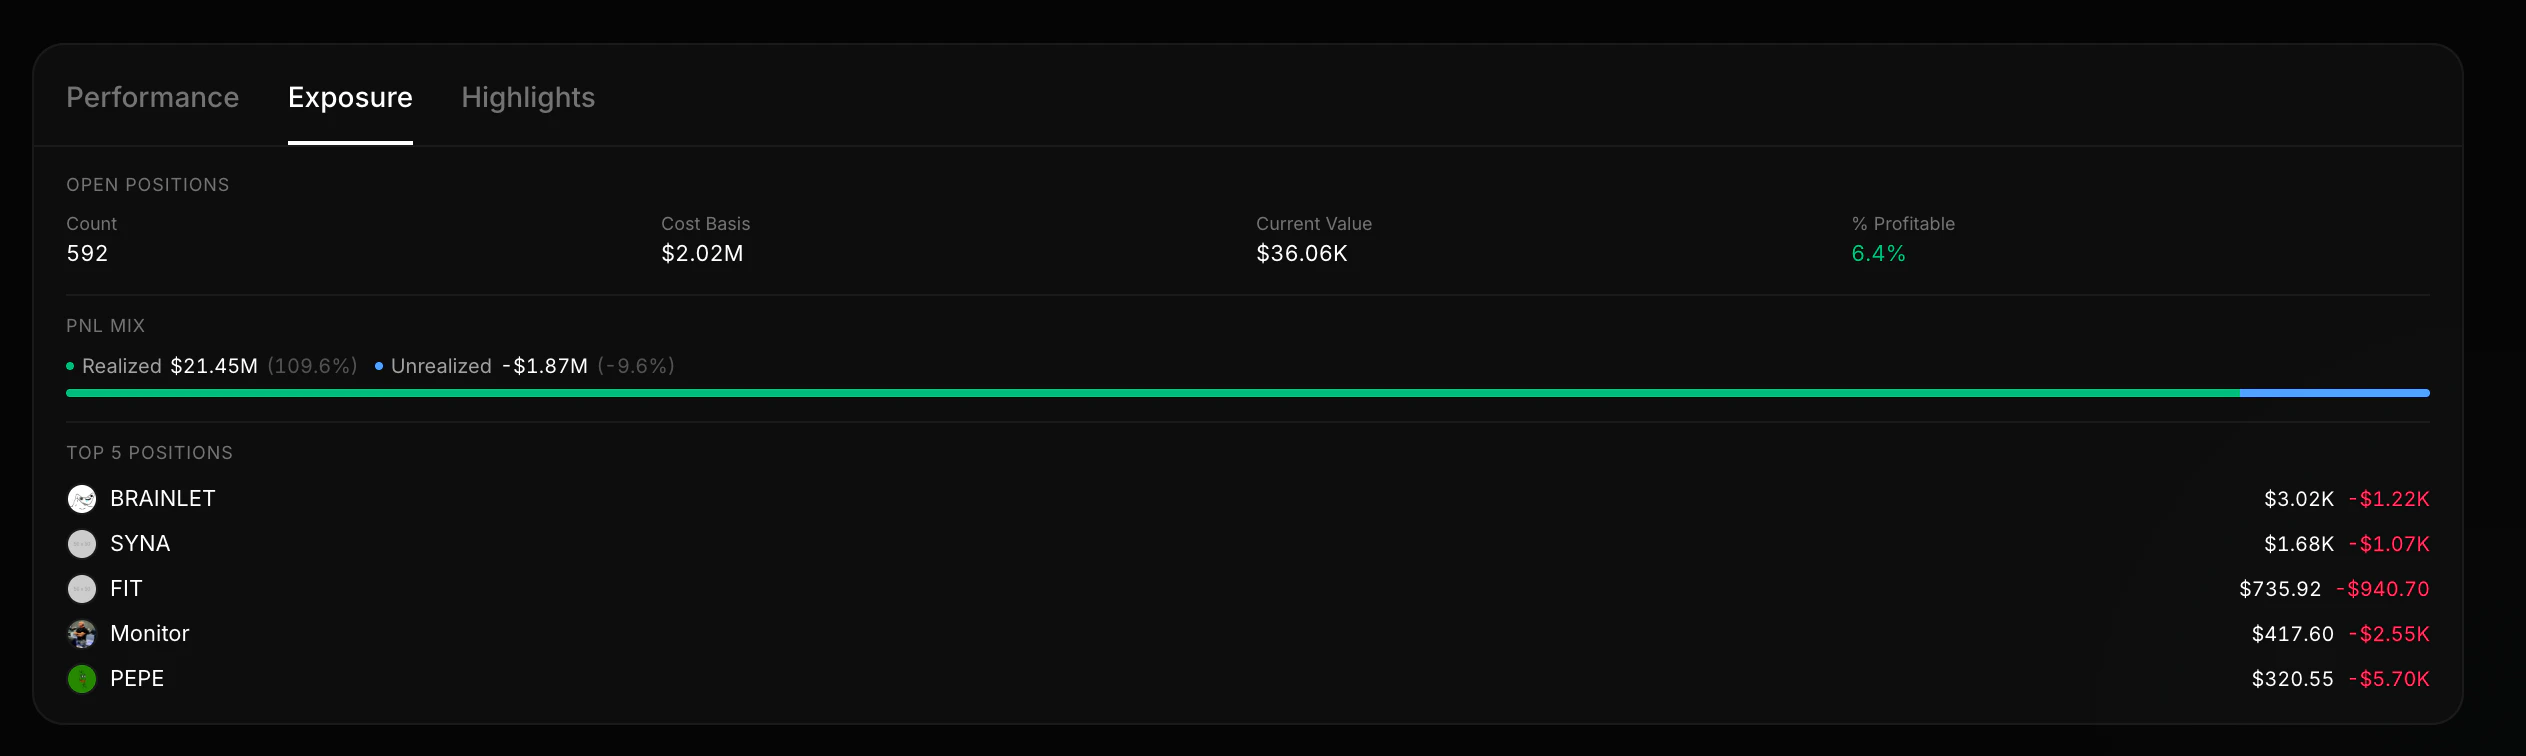
- Portfolio concentration — how much is in the top 1 and top 5 positions
- Realized vs unrealized split — is the wallet sitting on paper gains or locked-in profits?
- Open position value — total USD value of current holdings
- Risky holdings — list of tokens with low liquidity or high concentration risk
Live Updates
Keep a wallet in sync with the Datastream PnL V2 rooms instead of polling:pnl:{wallet}:summary— total wallet PnL summary with realized/unrealized PnL, ROI, counts, averages, and open-position totals.pnl:{wallet}— every token the wallet touches,tradeUpdate/balanceUpdate.pnl:{wallet}:{token}— a single position.
GET /v2/pnl/wallets/:wallet, then subscribe to the summary room. See the Datastream PnL guide for the full event payloads.
Next: Token Intelligence
See how a specific token was traded across wallets.
API Reference
Full schema details for the wallet summary response.