> ## Documentation Index
> Fetch the complete documentation index at: https://docs.solanatracker.io/llms.txt
> Use this file to discover all available pages before exploring further.
# Wallet Analysis
> Get any Solana wallet's PnL summary, open positions, daily history, risk exposure, portfolio chart, and standout trades with the PnL V2 wallet endpoints.
## Wallet Summary
Start here. The [wallet summary](/data-api/pnl-v2/get-wallet-summary) gives you the top-level view: total PnL, win rate, number of tokens traded, and ROI distribution.
```bash cURL theme={null}
curl "https://data.solanatracker.io/v2/pnl/wallets/{wallet}" \
-H "x-api-key: YOUR_API_KEY"
```
```javascript JavaScript theme={null}
const wallet = "CyaE1VxvBrahnPWkqm5VsdCvyS2QmNht2UFrKJHga54o";
const res = await fetch(`https://data.solanatracker.io/v2/pnl/wallets/${wallet}`, {
headers: { "x-api-key": "YOUR_API_KEY" }
});
const data = await res.json();
console.log(`Total PnL: $${data.summary.pnl.total.toFixed(2)}`);
console.log(`Win Rate: ${data.analysis.winRate}%`);
console.log(`Tokens Traded: ${data.summary.counts.tokensTraded}`);
```
```python Python theme={null}
import requests
wallet = "CyaE1VxvBrahnPWkqm5VsdCvyS2QmNht2UFrKJHga54o"
res = requests.get(
f"https://data.solanatracker.io/v2/pnl/wallets/{wallet}",
headers={"x-api-key": "YOUR_API_KEY"}
)
data = res.json()
print(f"Total PnL: ${data['summary']['pnl']['total']:.2f}")
print(f"Win Rate: {data['analysis']['winRate']}%")
```
***
## Token Positions
The [positions endpoint](/data-api/pnl-v2/get-wallet-positions) lists every token a wallet has traded. Sort by PnL, ROI, or value. Filter by holding state, market, minimum invested amount, and more.
### PnL Mode
The wallet summary, positions, and single-position endpoints support `?pnlMode=strict|adjusted|raw`. Default is `strict`, which filters out positions with sell amounts greater than buy amounts (usually invalid). Switch to `adjusted` for a cost-basis-corrected view, or `raw` to see everything unfiltered. See the [Essentials](/guides/pnl-v2/overview#essentials) for details.
```bash theme={null}
curl "https://data.solanatracker.io/v2/pnl/wallets/{wallet}/positions?pnlMode=adjusted" \
-H "x-api-key: YOUR_API_KEY"
```
### Common Filters
```bash theme={null}
GET /v2/pnl/wallets/{wallet}/positions?filter=profit&sort=total&direction=desc
```
```bash theme={null}
GET /v2/pnl/wallets/{wallet}/positions?filter=holding&sort=value&direction=desc
```
```bash theme={null}
GET /v2/pnl/wallets/{wallet}/positions?minInvested=100&sort=roi&direction=desc
```
```bash theme={null}
GET /v2/pnl/wallets/{wallet}/positions?market=pumpfun&sort=total&direction=desc
```
### Single Position
To drill into one token, use the [wallet token position](/data-api/pnl-v2/get-wallet-token-position) endpoint:
```bash theme={null}
GET /v2/pnl/wallets/{wallet}/tokens/{token}
```
Returns the full position: realized/unrealized PnL, cost basis, current value, buy/sell counts, trade timing, and token metadata.
***
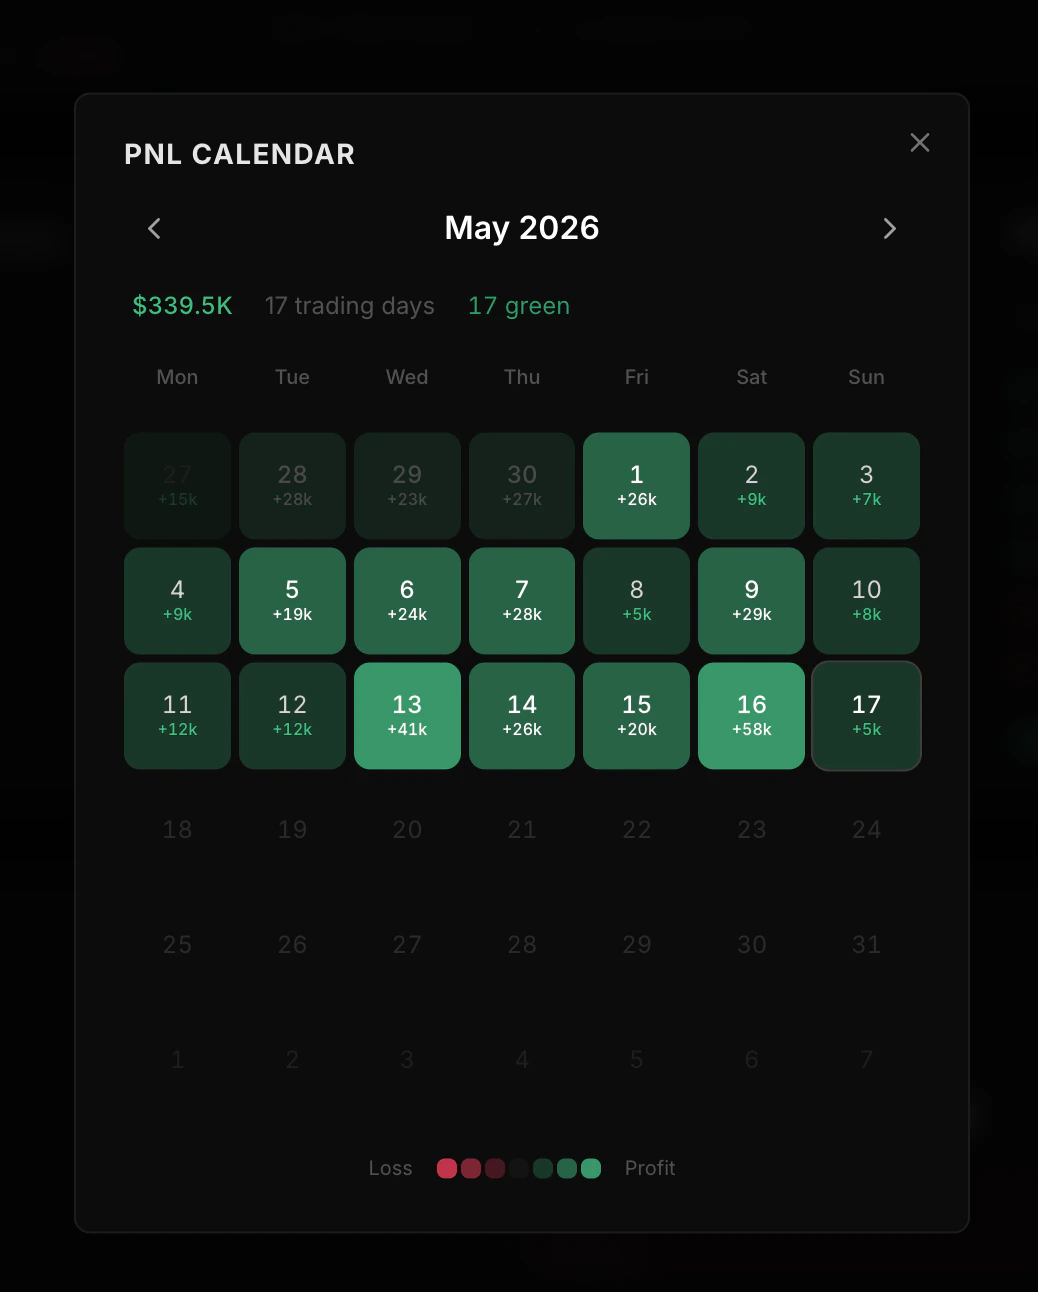
## PnL Calendar
The [PnL calendar endpoint](/data-api/pnl-v2/get-wallet-daily-history) shows how a wallet's PnL changed day by day.
 ```bash Last 30 days theme={null}
curl "https://data.solanatracker.io/v2/pnl/wallets/{wallet}/history?period=30d" \
-H "x-api-key: YOUR_API_KEY"
```
```bash Custom date range theme={null}
curl "https://data.solanatracker.io/v2/pnl/wallets/{wallet}/history?start=2025-01-01&end=2025-01-31" \
-H "x-api-key: YOUR_API_KEY"
```
Each day includes:
* **Running totals** — PnL, invested, and proceeds as of that day
* **Daily activity** — that day's realized PnL, volume, and trade counts
Use **history** when you need to explain what changed each day. Use **chart** when you need a visual equity curve.
***
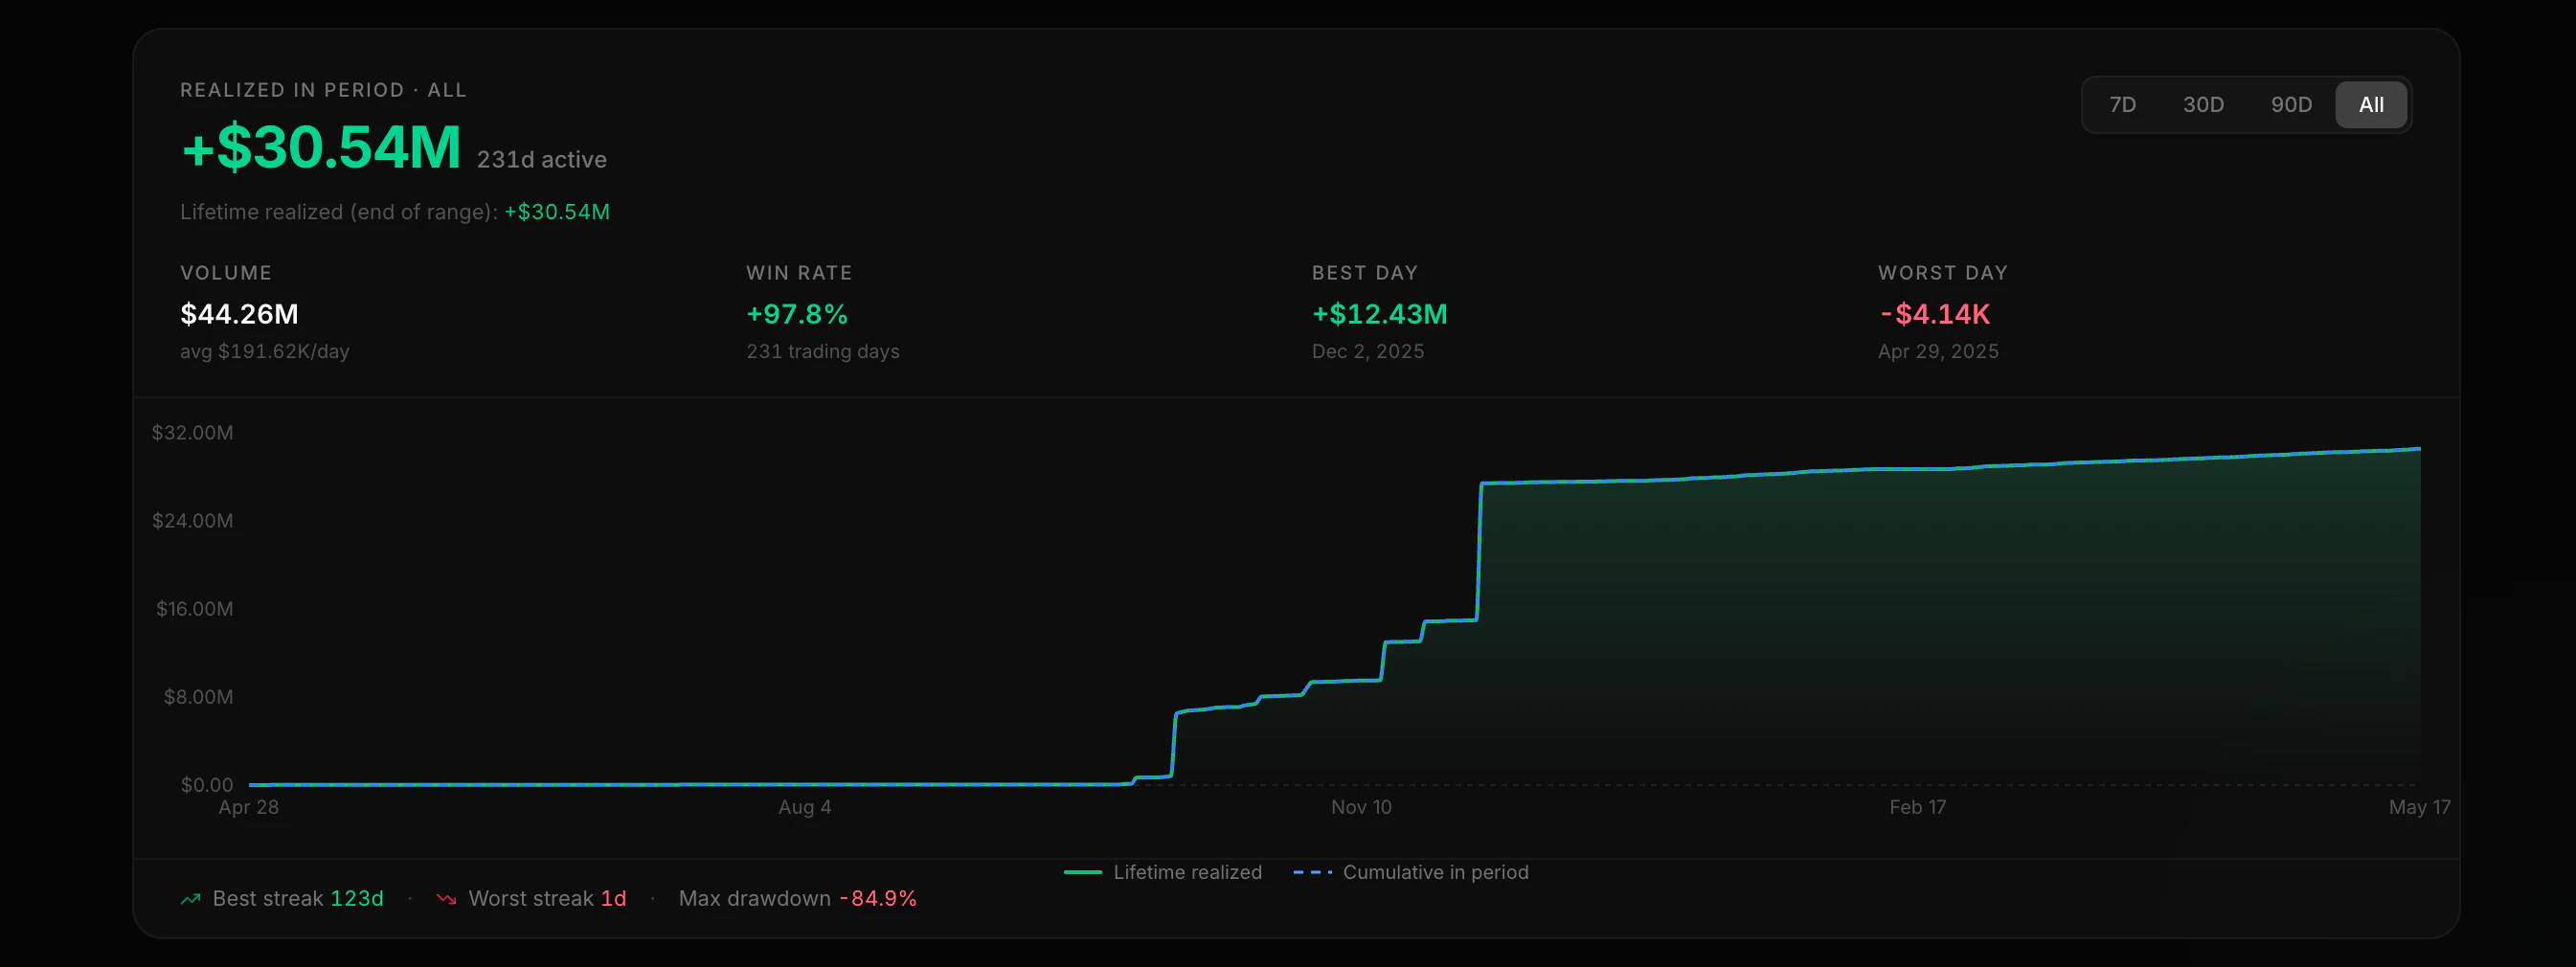
## Chart Data
The [chart endpoint](/data-api/pnl-v2/get-wallet-chart) returns up to 180 daily data points for plotting equity, realized PnL, and activity.
```bash Last 30 days theme={null}
curl "https://data.solanatracker.io/v2/pnl/wallets/{wallet}/history?period=30d" \
-H "x-api-key: YOUR_API_KEY"
```
```bash Custom date range theme={null}
curl "https://data.solanatracker.io/v2/pnl/wallets/{wallet}/history?start=2025-01-01&end=2025-01-31" \
-H "x-api-key: YOUR_API_KEY"
```
Each day includes:
* **Running totals** — PnL, invested, and proceeds as of that day
* **Daily activity** — that day's realized PnL, volume, and trade counts
Use **history** when you need to explain what changed each day. Use **chart** when you need a visual equity curve.
***
## Chart Data
The [chart endpoint](/data-api/pnl-v2/get-wallet-chart) returns up to 180 daily data points for plotting equity, realized PnL, and activity.
 ```javascript theme={null}
const wallet = "CyaE1VxvBrahnPWkqm5VsdCvyS2QmNht2UFrKJHga54o";
const res = await fetch(`https://data.solanatracker.io/v2/pnl/wallets/${wallet}/chart`, {
headers: { "x-api-key": "YOUR_API_KEY" }
});
const { points, summary } = await res.json();
// points is an array of daily chart rows
// summary contains streaks, drawdown, and win-rate style aggregates
console.log(points.length, summary.winRate);
```
Use `time_from` and `time_to` (Unix seconds) to page through older data.
***
## Performance
The [performance endpoint](/data-api/pnl-v2/get-wallet-performance) gives you rolling stats:
```javascript theme={null}
const wallet = "CyaE1VxvBrahnPWkqm5VsdCvyS2QmNht2UFrKJHga54o";
const res = await fetch(`https://data.solanatracker.io/v2/pnl/wallets/${wallet}/chart`, {
headers: { "x-api-key": "YOUR_API_KEY" }
});
const { points, summary } = await res.json();
// points is an array of daily chart rows
// summary contains streaks, drawdown, and win-rate style aggregates
console.log(points.length, summary.winRate);
```
Use `time_from` and `time_to` (Unix seconds) to page through older data.
***
## Performance
The [performance endpoint](/data-api/pnl-v2/get-wallet-performance) gives you rolling stats:
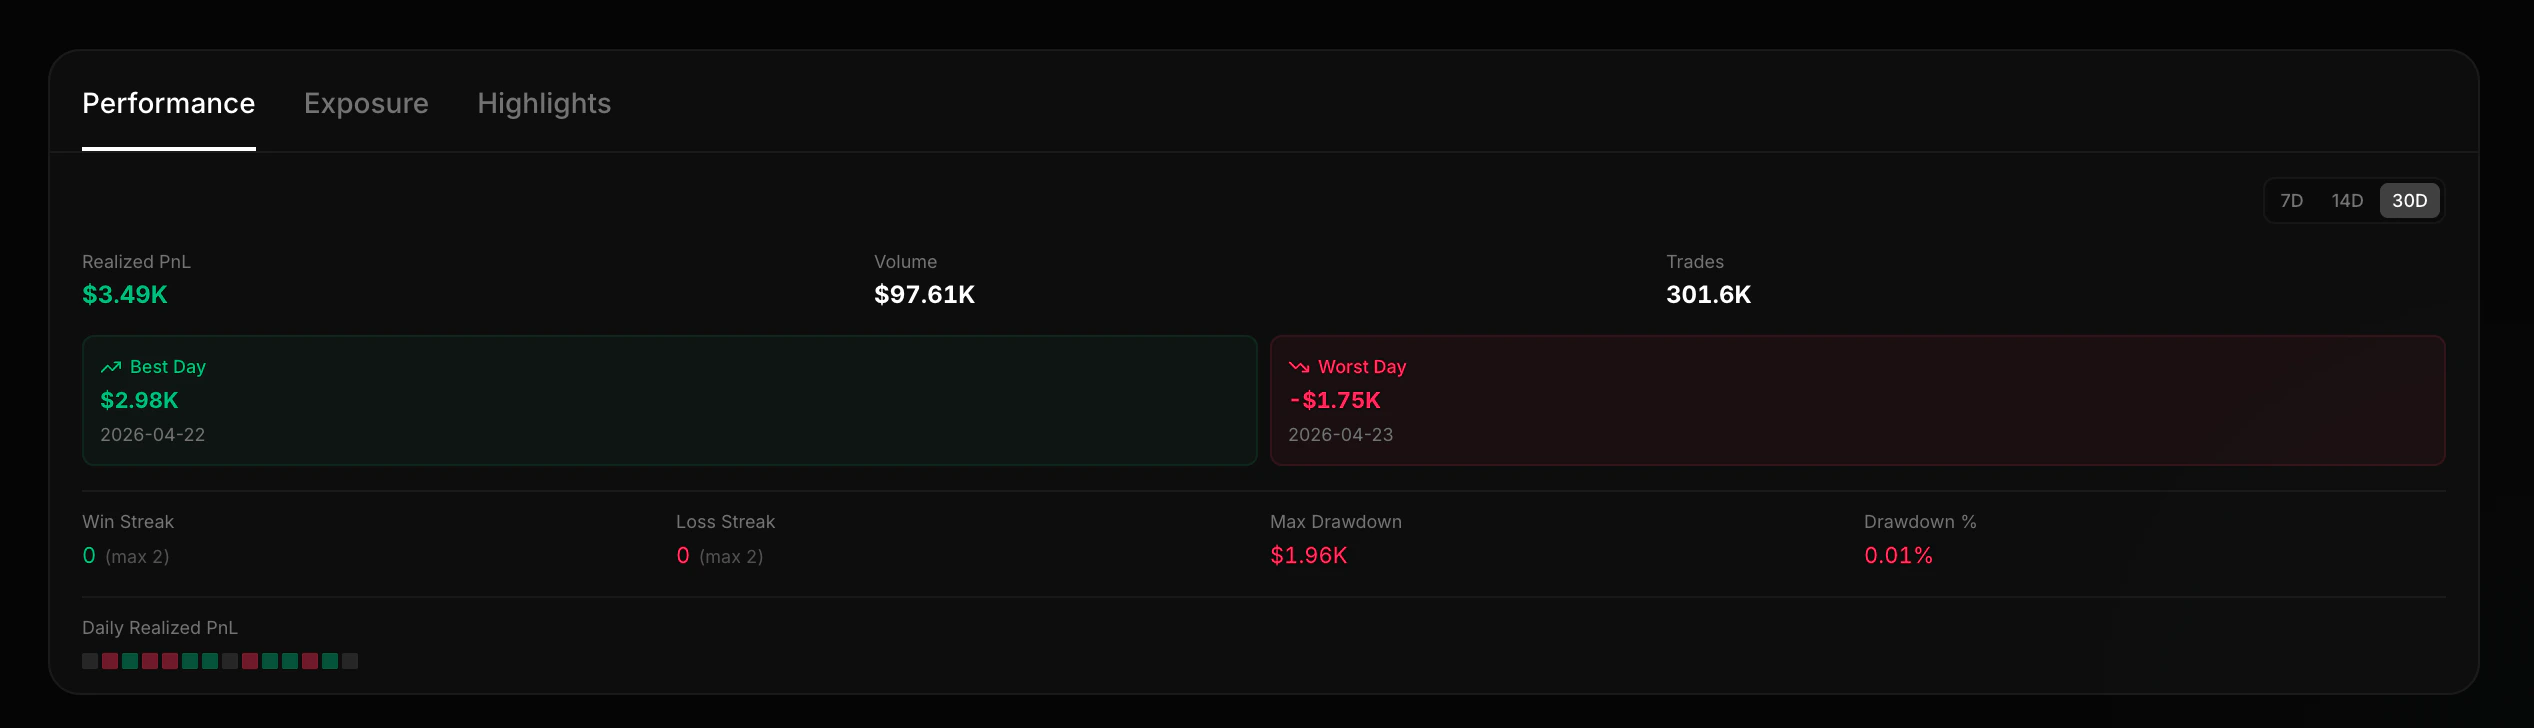 | Metric | Description |
| ------------------ | ----------------------------------------------------- |
| Total realized PnL | Sum of realized PnL in the window |
| Win/Loss streaks | Current and maximum consecutive winning/losing days |
| Maximum drawdown | Largest drop from the highest value to the lowest dip |
| Best/Worst days | The single best and worst trading days |
| Daily breakdown | Day-by-day PnL, volume, and trade counts |
```bash theme={null}
# Last 90 days performance
curl "https://data.solanatracker.io/v2/pnl/wallets/{wallet}/performance?days=90" \
-H "x-api-key: YOUR_API_KEY"
```
***
## Highlights
The [highlights endpoint](/data-api/pnl-v2/get-wallet-highlights) returns a wallet's most notable positions:
| Metric | Description |
| ------------------ | ----------------------------------------------------- |
| Total realized PnL | Sum of realized PnL in the window |
| Win/Loss streaks | Current and maximum consecutive winning/losing days |
| Maximum drawdown | Largest drop from the highest value to the lowest dip |
| Best/Worst days | The single best and worst trading days |
| Daily breakdown | Day-by-day PnL, volume, and trade counts |
```bash theme={null}
# Last 90 days performance
curl "https://data.solanatracker.io/v2/pnl/wallets/{wallet}/performance?days=90" \
-H "x-api-key: YOUR_API_KEY"
```
***
## Highlights
The [highlights endpoint](/data-api/pnl-v2/get-wallet-highlights) returns a wallet's most notable positions:
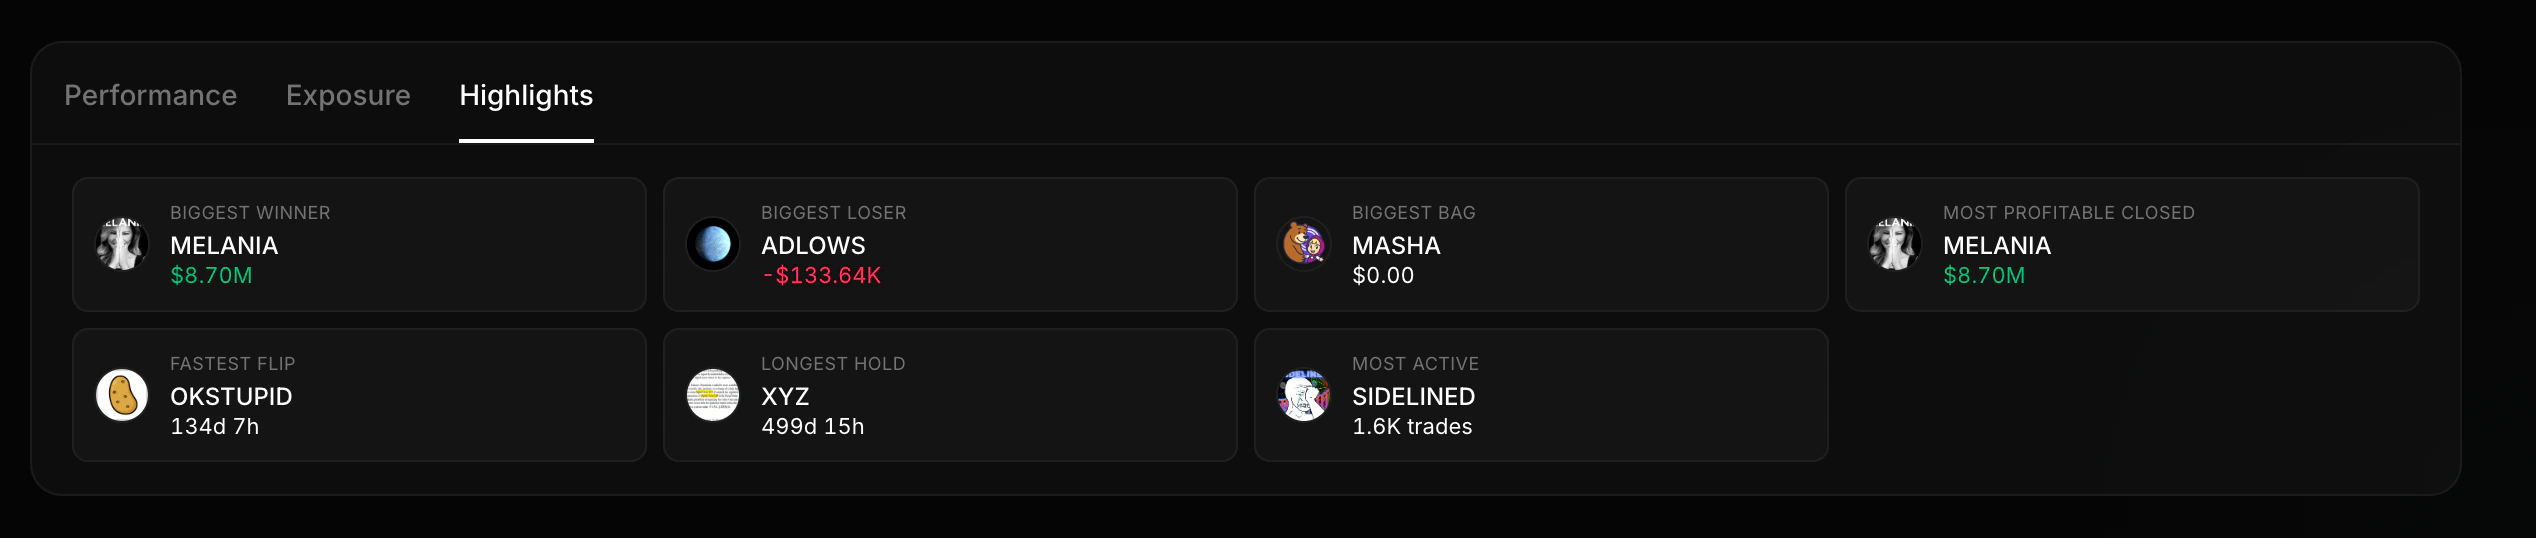 The position with the highest realized PnL
The position with the worst realized loss
Shortest hold time with a profit
The position held for the most time
Current holding with the highest USD value
The token with the most buy/sell transactions
```bash theme={null}
curl "https://data.solanatracker.io/v2/pnl/wallets/{wallet}/highlights" \
-H "x-api-key: YOUR_API_KEY"
```
***
## Risk
The [risk endpoint](/data-api/pnl-v2/get-wallet-risk) evaluates current portfolio exposure:
The position with the highest realized PnL
The position with the worst realized loss
Shortest hold time with a profit
The position held for the most time
Current holding with the highest USD value
The token with the most buy/sell transactions
```bash theme={null}
curl "https://data.solanatracker.io/v2/pnl/wallets/{wallet}/highlights" \
-H "x-api-key: YOUR_API_KEY"
```
***
## Risk
The [risk endpoint](/data-api/pnl-v2/get-wallet-risk) evaluates current portfolio exposure:
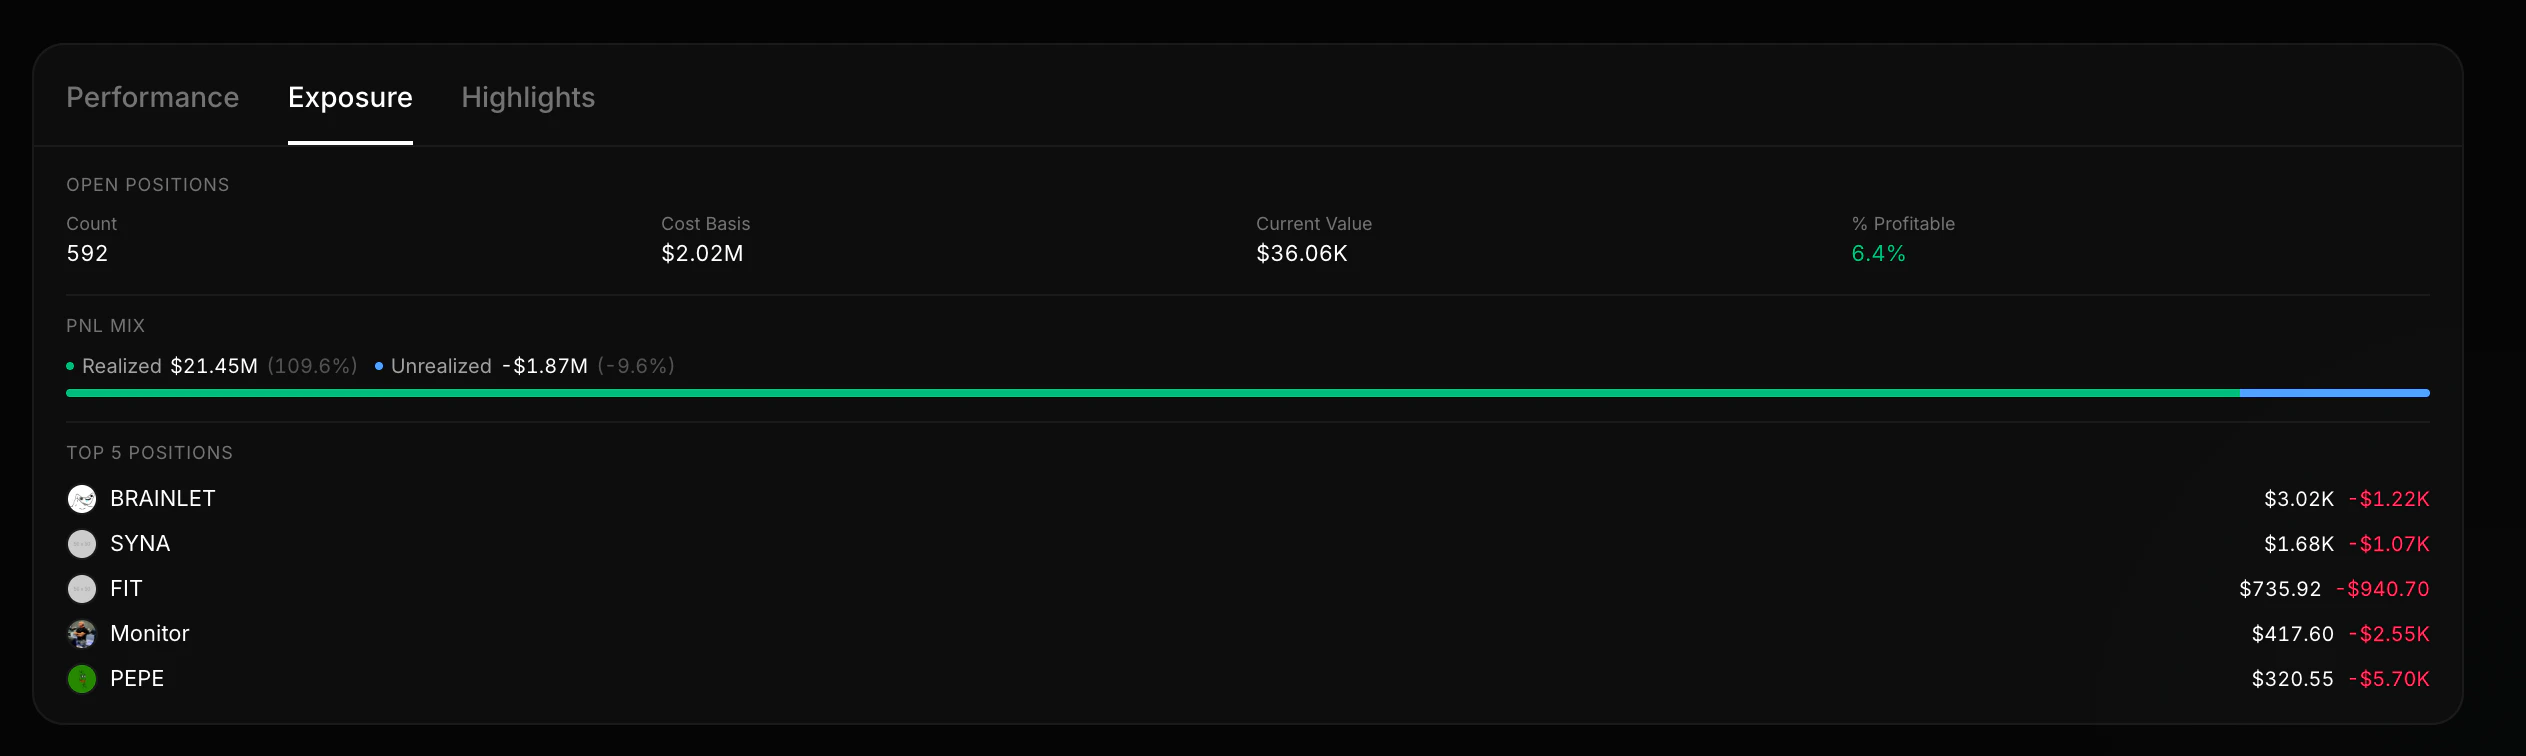 * **Portfolio concentration** — how much is in the top 1 and top 5 positions
* **Realized vs unrealized split** — is the wallet sitting on paper gains or locked-in profits?
* **Open position value** — total USD value of current holdings
* **Risky holdings** — list of tokens with low liquidity or high concentration risk
```bash theme={null}
curl "https://data.solanatracker.io/v2/pnl/wallets/{wallet}/risk" \
-H "x-api-key: YOUR_API_KEY"
```
Risk only covers **current holdings**. Sold positions aren't included.
***
## Live Updates
Keep a wallet in sync with the Datastream PnL V2 rooms instead of polling:
* `pnl:{wallet}:summary` — total wallet PnL summary with realized/unrealized PnL, ROI, counts, averages, and open-position totals.
* `pnl:{wallet}` — every token the wallet touches, `tradeUpdate` / `balanceUpdate`.
* `pnl:{wallet}:{token}` — a single position.
Seed your UI with `GET /v2/pnl/wallets/:wallet`, then subscribe to the summary room. See the [Datastream PnL guide](/guides/datastream-pnl) for the full event payloads.
See how a specific token was traded across wallets.
Full schema details for the wallet summary response.
* **Portfolio concentration** — how much is in the top 1 and top 5 positions
* **Realized vs unrealized split** — is the wallet sitting on paper gains or locked-in profits?
* **Open position value** — total USD value of current holdings
* **Risky holdings** — list of tokens with low liquidity or high concentration risk
```bash theme={null}
curl "https://data.solanatracker.io/v2/pnl/wallets/{wallet}/risk" \
-H "x-api-key: YOUR_API_KEY"
```
Risk only covers **current holdings**. Sold positions aren't included.
***
## Live Updates
Keep a wallet in sync with the Datastream PnL V2 rooms instead of polling:
* `pnl:{wallet}:summary` — total wallet PnL summary with realized/unrealized PnL, ROI, counts, averages, and open-position totals.
* `pnl:{wallet}` — every token the wallet touches, `tradeUpdate` / `balanceUpdate`.
* `pnl:{wallet}:{token}` — a single position.
Seed your UI with `GET /v2/pnl/wallets/:wallet`, then subscribe to the summary room. See the [Datastream PnL guide](/guides/datastream-pnl) for the full event payloads.
See how a specific token was traded across wallets.
Full schema details for the wallet summary response.