> ## Documentation Index
> Fetch the complete documentation index at: https://docs.solanatracker.io/llms.txt
> Use this file to discover all available pages before exploring further.
# 价格与图表
> 使用 Solana Tracker Data API 获取 Solana 代币的实时价格、历史 OHLCV K 线、指定时间戳价格以及多代币价格快照与图表数据。
Data API 提供了多种获取代币价格的方式:单一实时价格、历史 K 线数据和批量多代币查询。
## 实时价格
[price 端点](/cn/data-api/get-token-price)返回任意代币的当前价格。
```bash cURL theme={null}
curl "https://data.solanatracker.io/price?token=So11111111111111111111111111111111111111112" \
-H "x-api-key: YOUR_API_KEY"
```
```javascript JavaScript theme={null}
const res = await fetch(
"https://data.solanatracker.io/price?token=So11111111111111111111111111111111111111112",
{ headers: { "x-api-key": "YOUR_API_KEY" } }
);
const { price } = await res.json();
console.log(`SOL: $${price}`);
```
***
## 多代币价格
需要一批代币的价格?使用[多价格端点](/cn/data-api/get-multiple-token-prices)一次性获取它们,而不是发起单个请求。
```bash GET (逗号分隔) theme={null}
curl "https://data.solanatracker.io/price/multi?tokens=So111...112,38Pgz...pump" \
-H "x-api-key: YOUR_API_KEY"
```
```bash POST (JSON 主体) theme={null}
curl -X POST "https://data.solanatracker.io/price/multi" \
-H "x-api-key: YOUR_API_KEY" \
-H "Content-Type: application/json" \
-d '{ "tokens": ["So111...112", "38Pgz...pump"] }'
```
***
## OHLCV 图表数据
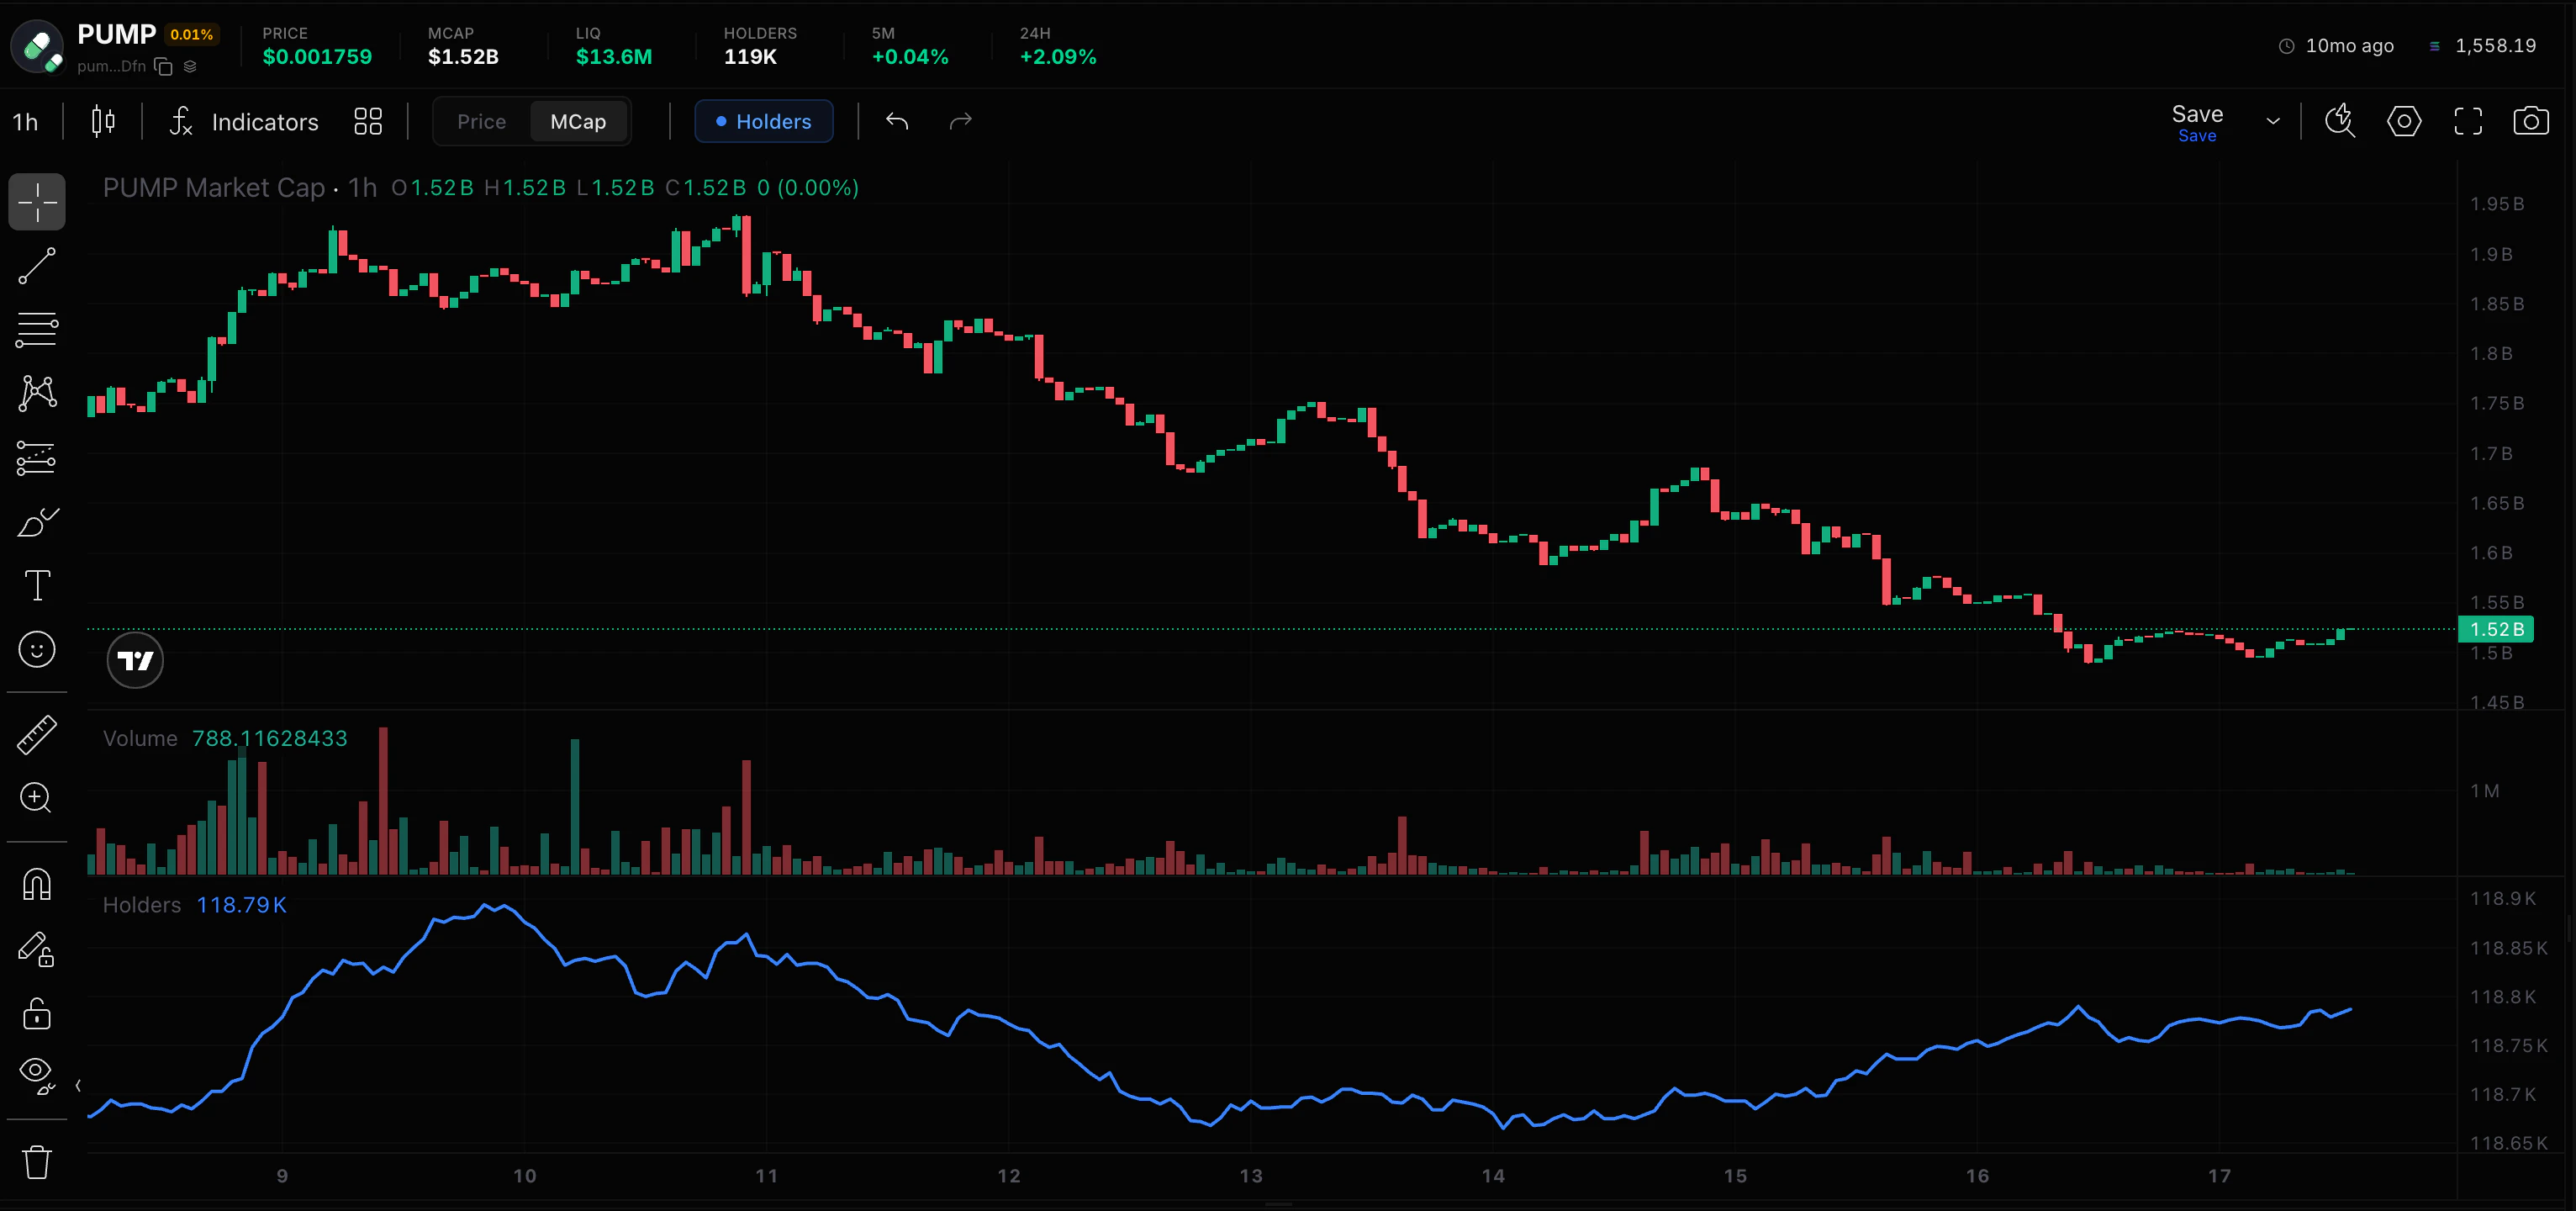
[OHLCV 端点](/cn/data-api/get-ohlcv-data-for-a-token)返回用于绘制图表的 K 线数据。OHLCV 表示开盘、最高、最低、收盘和成交量。
 ```bash cURL theme={null}
curl "https://data.solanatracker.io/chart/{token}?type=1h&time_from=1710000000&time_to=1710086400" \
-H "x-api-key: YOUR_API_KEY"
```
```javascript JavaScript theme={null}
const token = "38PgzpJYu2HkiYvV8qePFakB8tuobPdGm2FFEn7Dpump";
const res = await fetch(
`https://data.solanatracker.io/chart/${token}?type=1h&time_from=1710000000&time_to=1710086400`,
{ headers: { "x-api-key": "YOUR_API_KEY" } }
);
const candles = await res.json();
candles.forEach(c => {
console.log(`${new Date(c.time * 1000).toISOString()}: O=${c.open} H=${c.high} L=${c.low} C=${c.close} V=${c.volume}`);
});
```
### K 线间隔
| `type` 值 | 间隔 |
| -------- | ----- |
| `1s` | 1 秒 |
| `5s` | 5 秒 |
| `15s` | 15 秒 |
| `1m` | 1 分钟 |
| `3m` | 3 分钟 |
| `5m` | 5 分钟 |
| `15m` | 15 分钟 |
| `30m` | 30 分钟 |
| `1h` | 1 小时 |
| `2h` | 2 小时 |
| `4h` | 4 小时 |
| `6h` | 6 小时 |
| `8h` | 8 小时 |
| `12h` | 12 小时 |
| `1d` | 1 天 |
| `3d` | 3 天 |
| `1w` | 1 周 |
| `1mn` | 1 个月 |
### 特定池的图表
对于具有多个池的代币,请使用[特定池 OHLCV 端点](/cn/data-api/get-ohlcv-data-for-a-token-pool-pair)获取来自特定池的 K 线:
```bash theme={null}
curl "https://data.solanatracker.io/chart/{token}/{pool}?type=1h" \
-H "x-api-key: YOUR_API_KEY"
```
***
## 历史价格
### 特定时间的价格
[timestamp price 端点](/cn/data-api/get-price-at-specific-timestamp)返回代币在某个确切时间点的价值。
```bash theme={null}
curl "https://data.solanatracker.io/price/history/timestamp?token={token}×tamp=1710000000" \
-H "x-api-key: YOUR_API_KEY"
```
### 价格历史(时间序列)
[price history 端点](/cn/data-api/get-historic-price-information)返回历史价格数据点。
```bash theme={null}
curl "https://data.solanatracker.io/price/history?token={token}" \
-H "x-api-key: YOUR_API_KEY"
```
### 价格区间(最高/最低)
[price range 端点](/cn/data-api/get-lowest-and-highest-price-in-time-range)返回时间窗口内的最低和最高价格。
```bash theme={null}
curl "https://data.solanatracker.io/price/history/range?token={token}&time_from=1710000000&time_to=1710086400" \
-H "x-api-key: YOUR_API_KEY"
```
***
## 示例:构建价格面板
```javascript theme={null}
const token = "38PgzpJYu2HkiYvV8qePFakB8tuobPdGm2FFEn7Dpump";
const headers = { "x-api-key": "YOUR_API_KEY" };
// Current price
const { price } = await fetch(
`https://data.solanatracker.io/price?token=${token}`, { headers }
).then(r => r.json());
// Last 24h candles (1 hour intervals)
const now = Math.floor(Date.now() / 1000);
const candles = await fetch(
`https://data.solanatracker.io/chart/${token}?type=1h&time_from=${now - 86400}&time_to=${now}`, { headers }
).then(r => r.json());
// ATH
const ath = await fetch(
`https://data.solanatracker.io/tokens/${token}/ath`, { headers }
).then(r => r.json());
console.log(`Current: $${price}`);
console.log(`24h candles: ${candles.length}`);
console.log(`ATH: $${ath.highest}`);
```
### 开源图表示例
使用 Datastream WebSocket 的极简实时折线图。
带有实时 K 线更新的完整 TradingView 集成。
流式传输实时价格并构建实时更新的图表。
完整的代币查询:统计、持有者、交易和事件。
```bash cURL theme={null}
curl "https://data.solanatracker.io/chart/{token}?type=1h&time_from=1710000000&time_to=1710086400" \
-H "x-api-key: YOUR_API_KEY"
```
```javascript JavaScript theme={null}
const token = "38PgzpJYu2HkiYvV8qePFakB8tuobPdGm2FFEn7Dpump";
const res = await fetch(
`https://data.solanatracker.io/chart/${token}?type=1h&time_from=1710000000&time_to=1710086400`,
{ headers: { "x-api-key": "YOUR_API_KEY" } }
);
const candles = await res.json();
candles.forEach(c => {
console.log(`${new Date(c.time * 1000).toISOString()}: O=${c.open} H=${c.high} L=${c.low} C=${c.close} V=${c.volume}`);
});
```
### K 线间隔
| `type` 值 | 间隔 |
| -------- | ----- |
| `1s` | 1 秒 |
| `5s` | 5 秒 |
| `15s` | 15 秒 |
| `1m` | 1 分钟 |
| `3m` | 3 分钟 |
| `5m` | 5 分钟 |
| `15m` | 15 分钟 |
| `30m` | 30 分钟 |
| `1h` | 1 小时 |
| `2h` | 2 小时 |
| `4h` | 4 小时 |
| `6h` | 6 小时 |
| `8h` | 8 小时 |
| `12h` | 12 小时 |
| `1d` | 1 天 |
| `3d` | 3 天 |
| `1w` | 1 周 |
| `1mn` | 1 个月 |
### 特定池的图表
对于具有多个池的代币,请使用[特定池 OHLCV 端点](/cn/data-api/get-ohlcv-data-for-a-token-pool-pair)获取来自特定池的 K 线:
```bash theme={null}
curl "https://data.solanatracker.io/chart/{token}/{pool}?type=1h" \
-H "x-api-key: YOUR_API_KEY"
```
***
## 历史价格
### 特定时间的价格
[timestamp price 端点](/cn/data-api/get-price-at-specific-timestamp)返回代币在某个确切时间点的价值。
```bash theme={null}
curl "https://data.solanatracker.io/price/history/timestamp?token={token}×tamp=1710000000" \
-H "x-api-key: YOUR_API_KEY"
```
### 价格历史(时间序列)
[price history 端点](/cn/data-api/get-historic-price-information)返回历史价格数据点。
```bash theme={null}
curl "https://data.solanatracker.io/price/history?token={token}" \
-H "x-api-key: YOUR_API_KEY"
```
### 价格区间(最高/最低)
[price range 端点](/cn/data-api/get-lowest-and-highest-price-in-time-range)返回时间窗口内的最低和最高价格。
```bash theme={null}
curl "https://data.solanatracker.io/price/history/range?token={token}&time_from=1710000000&time_to=1710086400" \
-H "x-api-key: YOUR_API_KEY"
```
***
## 示例:构建价格面板
```javascript theme={null}
const token = "38PgzpJYu2HkiYvV8qePFakB8tuobPdGm2FFEn7Dpump";
const headers = { "x-api-key": "YOUR_API_KEY" };
// Current price
const { price } = await fetch(
`https://data.solanatracker.io/price?token=${token}`, { headers }
).then(r => r.json());
// Last 24h candles (1 hour intervals)
const now = Math.floor(Date.now() / 1000);
const candles = await fetch(
`https://data.solanatracker.io/chart/${token}?type=1h&time_from=${now - 86400}&time_to=${now}`, { headers }
).then(r => r.json());
// ATH
const ath = await fetch(
`https://data.solanatracker.io/tokens/${token}/ath`, { headers }
).then(r => r.json());
console.log(`Current: $${price}`);
console.log(`24h candles: ${candles.length}`);
console.log(`ATH: $${ath.highest}`);
```
### 开源图表示例
使用 Datastream WebSocket 的极简实时折线图。
带有实时 K 线更新的完整 TradingView 集成。
流式传输实时价格并构建实时更新的图表。
完整的代币查询:统计、持有者、交易和事件。